Whether a mission critical visualization system is in an automotive manufacturer, utility company or military environment, the quality of the data is paramount. Mission critical visualization typically refers to environments needing to make high level decisions that can be "million dollar" or "life and death" assessments utilizing high quality visual data. There are four main elements of visualization systems that can dramatically enhance the quality of your visual data.
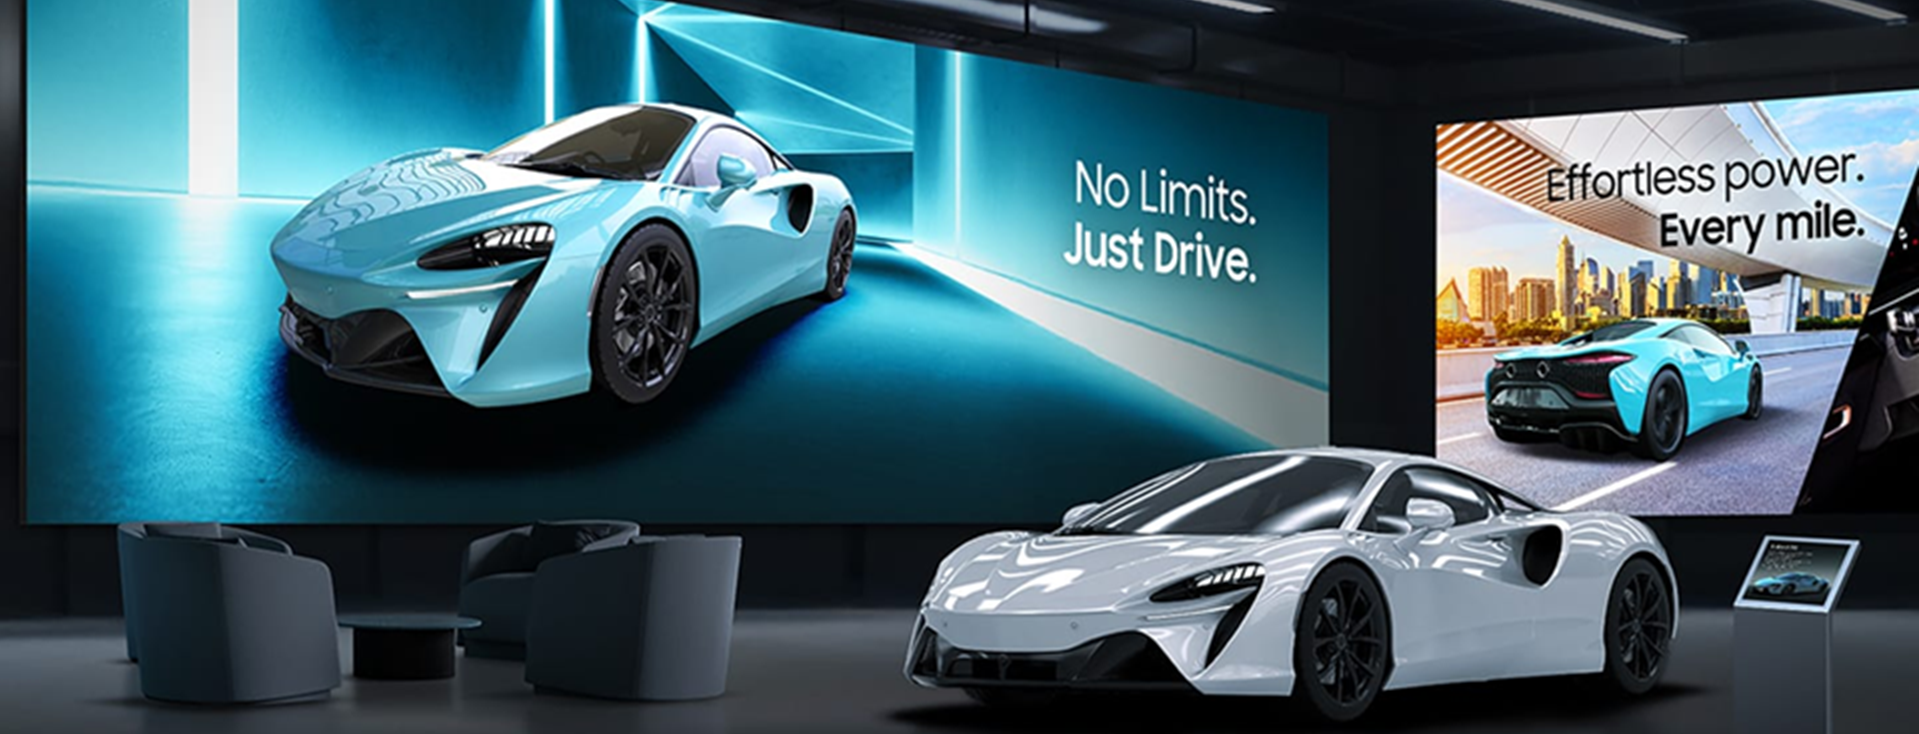
For many government agencies and corporations, the need to share and collaborate on this data clearly on a large scale is central to successful business operations. IGI calls this advanced visualization. Advanced visualization systems enable the display of vast amounts of data and complex computer models with rich detail, clarity and exceptional color. These ultra-high-resolution systems give designers and engineers the ability to work in a unique creative setting, and viewers the ability to better understand and more accurately analyze the displayed information.
If you are looking to improve your data visualization or are starting to integrate a visualization solution for the first time, you need to understand how to prepare your corporate infrastructure and the elements that drive image quality. The four elements of brightness, contrast, black levels and color all influence the quality of an advanced visualization display.
Brightness measures the quality of reflecting light in lumens. Early visualization systems focused on projector technology, but in many environments a dark room (imagine a movie theater) was needed to adequately. The dark room negatively affects collaboration and taking notes.
Projectors have become certainly become brighter to offset this, with some laser projectors capable of displaying up to 60,000 lumens, but direct view LED is fast becoming the predominate leader in video wall technology used in advanced visualization solutions. LED almost makes ambient light in a room a non-issue which greatly improves note taking and collaboration.
Contrast refers to the ratio between a system’s brightest capability (white level) and its darkest capability (black level). For example, a system with a black level of 100 nits and a white level of 1000 nits would have a contrast ratio of 10 to one.
The latest generation of LED displays area actually produces 1,000,000:1 contrast ratios. Yes, that is a million to one contract, stunning. The higher the contrast, the better the display because users can see more detail in the image data.
Black levels measure how deep the color black is displayed on the screen. Black level affects image quality because the human eye is good at adjusting to brightness and determining different levels of bright and dark. High brightness and deep black levels allow our eyes to find more detail in an image. Older technology never quite got to pure black because projectors using light or early LED and LCD displays that were backlit, again with light so the blacks were more of a dark charcoal gray.
Today's LED technology is mounted in a pure black substrate and "turns off" when there is black data to be displayed, and you cannot get darker than the complete absence of light.
 Color measurement is commonly based on the RGB (Red, Green and Blue) color model, a triangle of reds, greens and blues that our eyes can see. Typical displays capture the middle of the color triangle, while exceptional monitors show the deepest colors, reaching to the outer edges of the RGB triangle.
Color depth, also known as bit depth, is the gradation of color a display can support. Eight-bit depth (256 levels per color) is the most widely available gradation, with 10 bit (1024 levels) becoming increasingly common.
It depends on your needs. For example, your manufacturing engineers probably won’t value color as much as they would contrast, while color might be the priority for your design team. If you need sufficient ambient light for note taking, high brightness might be important. Also keep in mind that with large scale visualization, the bigger the image, and the greater the number of pixels in the data, the compute solution to drive the data (images) also increases in complexity. It can be a complicated and possibly costly element to visualization and needs to be figured out hand in hand with the demands of integrating the newest visual technology.
If you’re considering integrating an advanced visualization system into your organization, IGI can help deliver an enhanced solution based on your exact applications, specifications and budget. IGI is an industry leader in the complete integration of ultra-high-resolution advanced visualization systems, including PowerWalls, CAVEs and Virtual Reality. We boast 25 years’ experience with advanced visualization in the audio visual industry managing all levels of AV integration projects.
Contact us for a consultation to learn more about how your company can realize the operational value of advanced visualization for your audio visual display needs.
Immersion Graphics, Inc. (IGI) provides audio visual design, engineering, consulting, product sales, control system programming, custom fabrication, installation, preventative maintenance, and extended support services out of its headquarters location in Detroit and west coast operation in Los Angeles. Additional offices are located in Indianapolis, and Grand Rapids.
Founded in 1998, IGI has installed numerous large-scale, ultra-high resolution systems throughout the U.S. in the automotive, higher education, medical, financial, and energy transmission markets, and for the United States military and other government agencies. Applications include industrial design, engineering and data visualization, mission-critical command & control room environments, presentation systems, video conferencing, digital signage, and a variety of commercial AV solutions for emerging markets where the simultaneous visualization of 3D models and complex data by a group is essential to effective decision making. To get an in depth look at what we do, see our website at www.werigi.com, we are IGI.
IGI is minority owned, veteran owned, and a small business and SBA 8(a) program graduate.